You walk out of every quarterly security review (QSR) with the same uneasy feeling: you just presented 45 minutes of charts, and you still can’t prove the organization is more secure than last quarter.
You walk out of every quarterly security review (QSR) with the same uneasy feeling: you just presented 45 minutes of charts, and you still can’t prove the organization is more secure than last quarter.
Alerts are being triaged, tools are running, and the slides look full, but when leadership asks if things are getting better, the honest answer is: you don’t actually know.
That’s because most security products measure activity, not outcomes in their QSRs. Here’s an example of what you can measure to fix that and take an outcomes-based approach to cloud security that actually resonates with C-level.
Every security leader knows this feeling. The gap between how much work your team is doing and how little you can prove for it. You’re not imagining it.
That frustration usually stems from three problems that rarely make it onto a slide.
You’ve invested heavily in security tooling like CNAPPs, DSPMs, CDRs, and vulnerability scanners. Leadership wants to know what they’re getting from that investment.
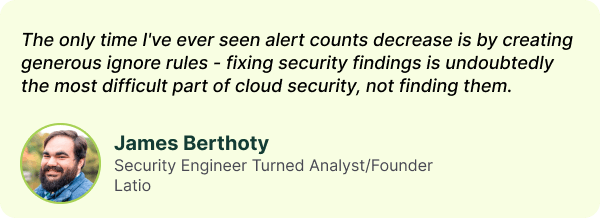
But when your tool’s dashboards and reports center on how many alerts you found, you’re essentially reporting that your expensive tools are generating work. That’s not ROI. That’s the price you pay to generate each alert, better known as overhead.
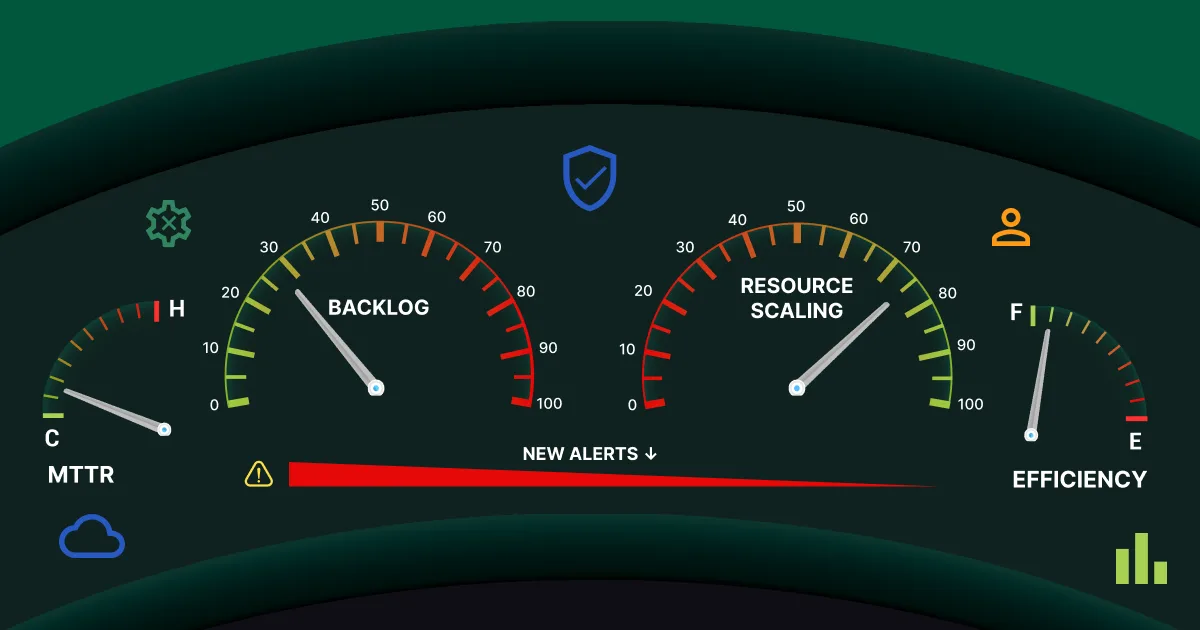
Despite all the effort, your mean time to remediate (MTTR) stays high.
Quarter after quarter, the number barely moves.
You’re closing tickets, but the backlog never shrinks, the exposure window stays open, and you can’t explain why. Alerts are being generated, but without proper prioritization, context, and time for investigations, they often get ignored.
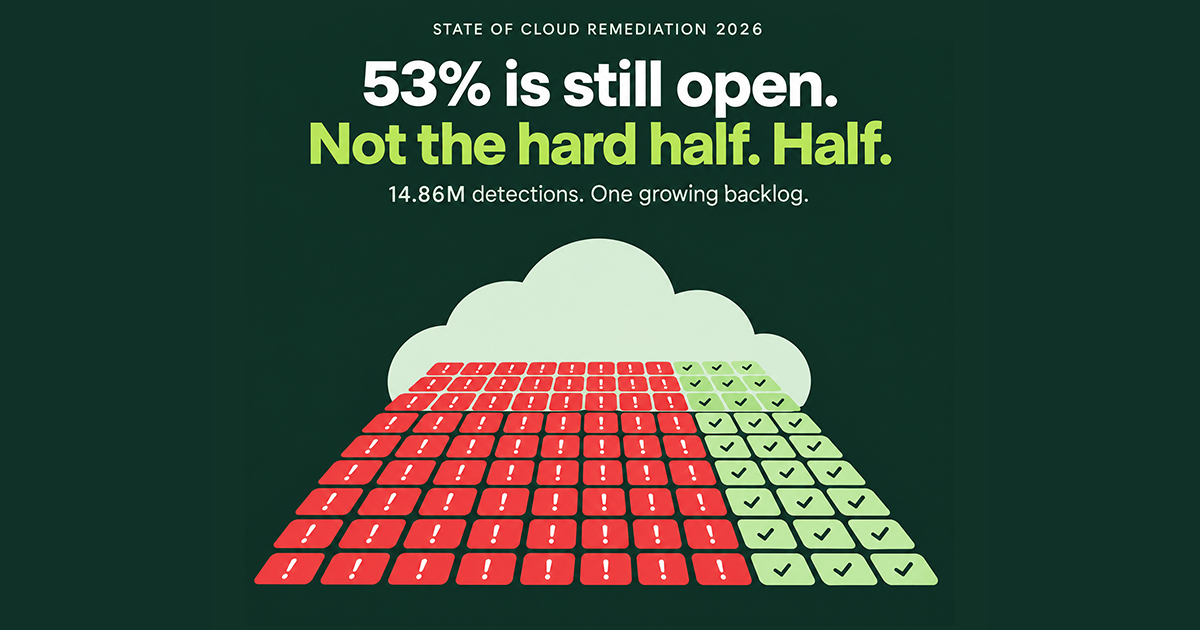
These are the exact challenges we uncovered after analyzing 4.7 million alerts in our 2025 State of Cloud Remediation report.
Your tools report coverage percentages and alert numbers. Once you present these, the board nods politely, but they don’t really understand if the organization is safer than it was 90 days ago, and honestly, neither do you.
The metrics you’re showing don’t answer the question that actually matters.
Traditional QSRs focus on inputs and activity. They indicate something is wrong, but rarely explain why or identify the root cause, and more importantly, what you are planning to do about it. That’s because you’re focusing on treating symptoms rather than the underlying disease.
Here are some of the vanity metrics they typically focus on:
These metrics measure motion, not progress towards real outcomes. They create the illusion of security improvement without evidence of it. It’s like tracking hours at the gym instead of whether you’re actually getting stronger. You can show up every day, log every session, and still make no progress if you’re not measuring the right things.
The shift is simple: stop reporting what you found and start reporting what you fixed, and whether it stays fixed. This is how you measure real progress in cloud security.
Here are five metrics that answer the questions leadership actually cares about:
Are you closing more issues than you’re opening?
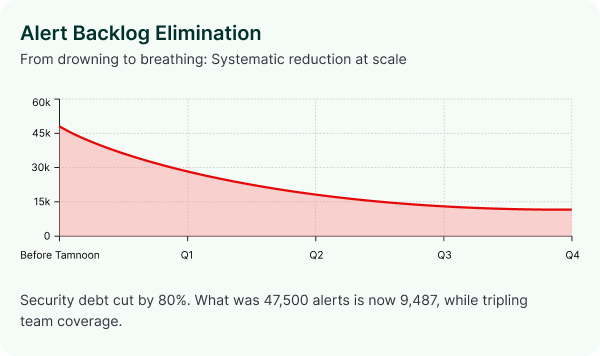
Every quarter, your QSR should show the net position for issues opened versus issues closed.

One enterprise security team working with Tamnoon tracked this over four quarters. They went from a backlog of 47,500 open alerts to 9,500 (an 80% reduction) while tripling their coverage. This was a clear shift from tracking activity to measuring progress.
If your backlog is flat or growing, your current approach isn’t working. This metric makes that visible.
How long are vulnerabilities sitting open before they’re fixed?
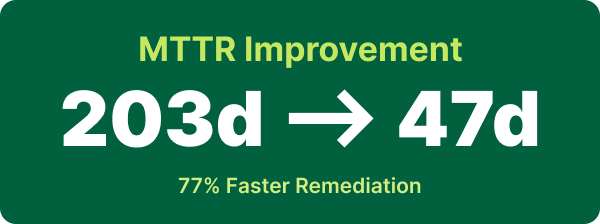
Mean time to remediate is the metric boards should care about most. It represents your exposure window, or more simply, how long vulnerabilities sit open before they’re resolved.
Tracking MTTR quarter over quarter reveals whether your processes are improving. One of our customers reduced theirs from 203 days to 47 days (77% faster) by focusing on root-cause fixes rather than alert-by-alert triage.
Think of a misconfigured S3 bucket:
If your MTTR isn’t moving, you’re likely treating symptoms, not causes. But if you don’t address the underlying problem, it’ll keep recurring.
Are your fixes actually sticking?
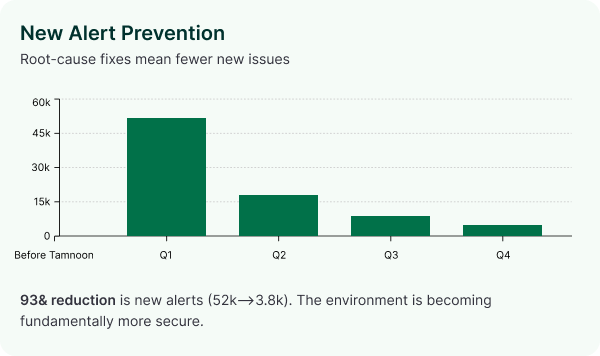
This is the metric that separates real remediation from whack-a-mole.
When you fix root causes like misconfigurations in templates, policy gaps, and architectural issues, the same alerts stop regenerating. One organization saw new alerts drop from 52,000 to 3,800 over four quarters, a 93% reduction.
This is how you solve alert fatigue at the source. Instead of asking your team to triage faster, you’re giving them fewer alerts to triage in the first place. That shift, from managing volume to reducing it, is one of the most meaningful things you can show in a QSR.
From an outcomes perspective, this demonstrates that your environment is becoming fundamentally more secure.
Is your team chasing tickets or solving problems?
It’s important to know how much noise you need to filter to reach the signal.
The best security operations don’t work alert-by-alert. They consolidate thousands of findings into prioritized initiatives based on actual business risk. A 142:1 ratio, which means 142 alerts distilled into one actionable initiative, shows mature prioritization.
For example, a single overly permissive IAM policy attached to 50 different roles will trigger 50 separate alerts. But you don’t have 50 problems, you have one misconfigured policy. Fix it once, and all 50 alerts resolve.
This metric answers the ROI question directly: you’re not paying for alerts, you’re paying for outcomes.
Can you do more without hiring more?

For most companies, cloud security resources are scarce.
That’s why you must track workload growth against team capacity. If you’re handling 3x the remediation volume with the same team size, that’s a clear demonstration of operational efficiency. If every increase in scope requires hiring, your approach doesn’t scale.
One of our customers processed 120,000+ remediations while saving the equivalent of 6 FTEs annually. That’s the kind of number that makes CFOs pay attention because it clearly quantifies ROI.
Here’s a simple litmus test for your next quarterly review.
After the meeting ends, can you confidently say (and prove) that your organization is more secure than last quarter?
If you can’t, you’re probably measuring the wrong things.
This is what Tamnoon customers see every quarter. Exposed risks that actually get fixed, backlog that shrinks instead of churns, MTTR that finally moves, and a QSR that proves security is improving, not just busy for the sake of it.